

OpenSurf - let's make surf forecasting open to everyone
A quick intro to my current project & weekly updates going forward.

Hi team!
Welcome to my first post in a *series* where I’ll be outlining my process of building OpenSurf.org from scratch.
What is OpenSurf?
My goal with OpenSurf is to provide an easy-to-use, beautiful, and fully open-source surf forecasting tool that’s accessible to everyone. I’m aiming to officially launch OpenSurf as an open-source project sometime this year…
Still with me? Great! Let’s dive into this week’s progress on the project :)
Starting from Zero
Over the last few months, I’ve been mulling over the issues I have with current surf forecasting solutions. To be honest, this project stems from feeling a bit underwhelmed by the state of online surf forecasting today. In many cases, the predictions aren’t very accurate, the UI is cluttered with ads, the applications are slow and laggy, and the existing solutions can be surprisingly expensive.
That led me to a question: what if I built a small web application just for me and my friends? What if it had zero ads, an elegant UI, and better predictions? I would totally use that.
But first, I needed to think through the scope of the project:
What exactly was I trying to accomplish?
What is the ‘main’ idea or core competency of this project?
Are there existing tools that could help me build something like this?
What’s the smallest working prototype I can create?
Where can I find all the data I need?
These were just some of the questions I considered before sitting down at the computer and writing any code.
Python’s `request` library
One of the first tools I stumbled upon was Python’s requests library, which allows me to make API calls directly in Python. This was huge for fetching data from various sources to put together a simple prototype.
Next, I was stoked to find out that:
We have a National Data Buoy Center (so clutch).
It’s possible to retrieve data from it using simple HTTPS requests.
This was perfect—it meant I had everything I needed to get a tiny working prototype running in the terminal.
This week’s progress
I started by coding a quick method to retrieve the buoy data:
 def get_conditions(self):
        url = "https://www.ndbc.noaa.gov/data/realtime2/" + str(self.buoy) + ".txt"
        response = requests.get(url)
        # Get string if response successful (status 200)
        if response.status_code == 200:
            data = response.text
            return data
        else:
            return None
BOOM! This started returning real-time conditions like wave height, swell direction, wave period, wind speed, wind direction, ocean surface temperature, and tide.
Next, I needed to parse the data so we could actually store and read it in a useful way. One thing to note about the buoy data: it’s returned as one big ‘ol string. That means we need to parse, sort, and reformat it to make it usable for our little prototype.
Thankfully, the National Data Buoy Center provides a handy legend to help interpret what each entry—separated by spaces—actually means:
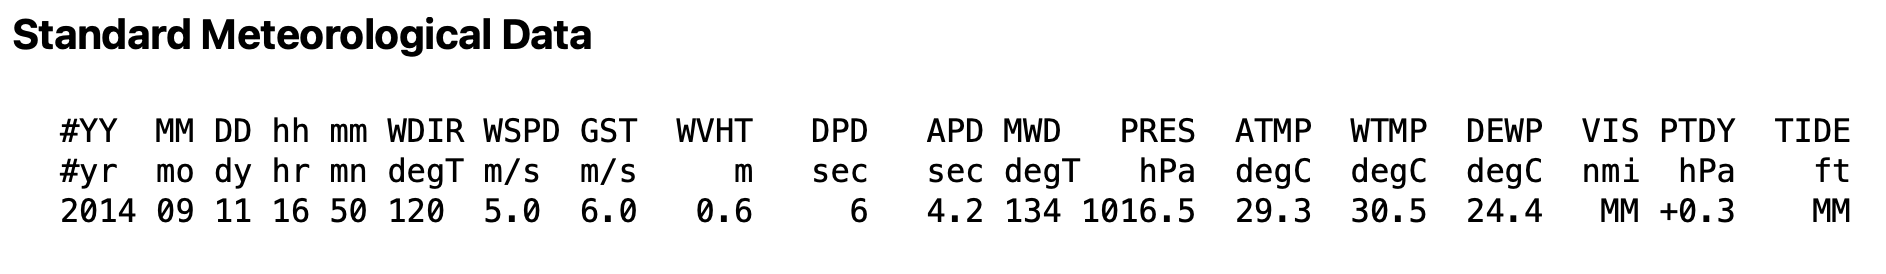
Writing the parser was a bit more complicated. But in essence, here’s what I did:
Split the returned data into lines—each one representing a timestamped entry, spaced about 10 minutes apart.
Split each line into its individual pieces of data.
Built a
datetimeobject from entries 0–4 of each row.Used this
datetimeobject as the key for a new dictionary containing all the relevant data.
I also added some data cleaning and exception handling to make sure the class wouldn’t completely melt down if a row was missing data or had fewer fields than expected, etc.
# Split to rows
        response_by_line = self.response.split('\n')
        response_by_line.pop(0) # remove header row

        # Build dict for each line of data with keys
        data_by_time = {}

        for line in response_by_line:
            row = line.split()
            if len(row) < 19:
                continue  # Skip incomplete lines

            try:
                timestamp = datetime(
                    int(row[0]),  # year
                    int(row[1]),  # month
                    int(row[2]),  # day
                    int(row[3]),  # hour
                    int(row[4]),   # minute
                    tzinfo=timezone.utc # make object timezone aware
                )

                if timestamp < cutoff:
                    continue  # Skip old data

                data_by_time[timestamp] = {
                    "wind_direction": self.clean(row[5]),
                    "wind_speed": self.clean(row[6]),
                    "wave_height": self.clean(row[8]),
                    "wave_period": self.clean(row[10]),
                    "wave_direction": self.clean(row[11]),
                    "water_temp": self.clean(row[14]),
                    "tide": self.clean(row[18])
                }

            except (IndexError, ValueError):
                continue  # Skip malformed or incomplete rows
I wrapped this (along with some other code) in a parse_conditions function within the OceanParse class—and just like that, I had a way to clean and read the data!
Next steps
Over the next week, I plan to work on a few things to keep the project moving forward:
Build a way to “average” the data from each hour to account for any gaps and display it in the terminal.
Create a quick landing page for the project that directs people to these update posts.
And that’s it! Thanks for taking the time to read this week’s update. Let me know if you’re stoked about the project and consider subscribing to see more updates.
Cheers,
Morgan